data(sdi90_19)
head(sdi90_19)
#> # A tibble: 6 × 3
#> location year value
#> <chr> <dbl> <dbl>
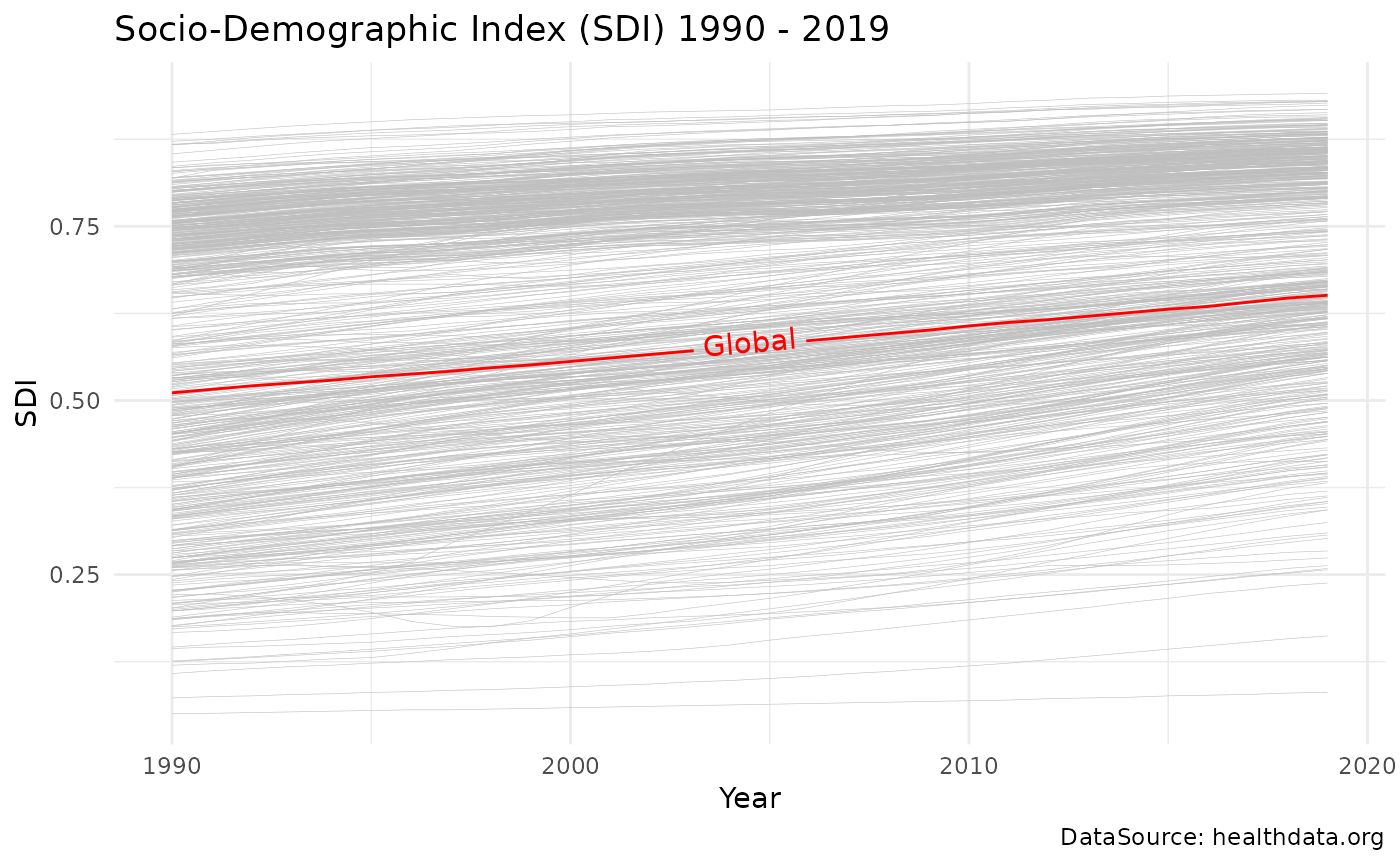
#> 1 Global 1990 0.511
#> 2 Global 1991 0.516
#> 3 Global 1992 0.521
#> 4 Global 1993 0.525
#> 5 Global 1994 0.529
#> 6 Global 1995 0.534
sdi_avg |>
  ggplot(aes(x = year, sdi_avg, group = location)) +
  geom_line(
    show.legend = F,
    color = "grey",
    linewidth = 0.1
  ) +
  geomtextpath::geom_textpath(
    data = sdi_avg |>
      filter(location == "Global"),
    aes(label = location),
    color = "red"
  ) +
  ggtitle("Socio-Demographic Index (SDI) 1990 - 2019") +
  labs(
    caption = "DataSource: healthdata.org",
    x = "Year", y = "SDI"
  )