Overview
Data: https://www.ngdc.noaa.gov/mgg/global/relief/ETOPO1/data/ice_surface/grid_registered/georeferenced_tiff/ETOPO1_Ice_g_geotiff.zip
library(terra)
library(ggplot2)
library(sf)
# Load bathymetry (ETOPO1 through marmap or directly)
# Example with terra:
bathy <- rast("ETOPO1_Ice_g_geotiff.tif")
# Crop for a focus region (e.g., Mediterranean)
med_box <- ext(-10, 40, 30, 48)
med <- crop(bathy, med_box)
med_df <- as.data.frame(med, xy = TRUE) |>
  janitor::clean_names()
summary(med_df$etopo1_ice_g_geotiff)
ggplot(med_df) +
geom_raster(aes(x = x, y = y, fill = etopo1_ice_g_geotiff)) +
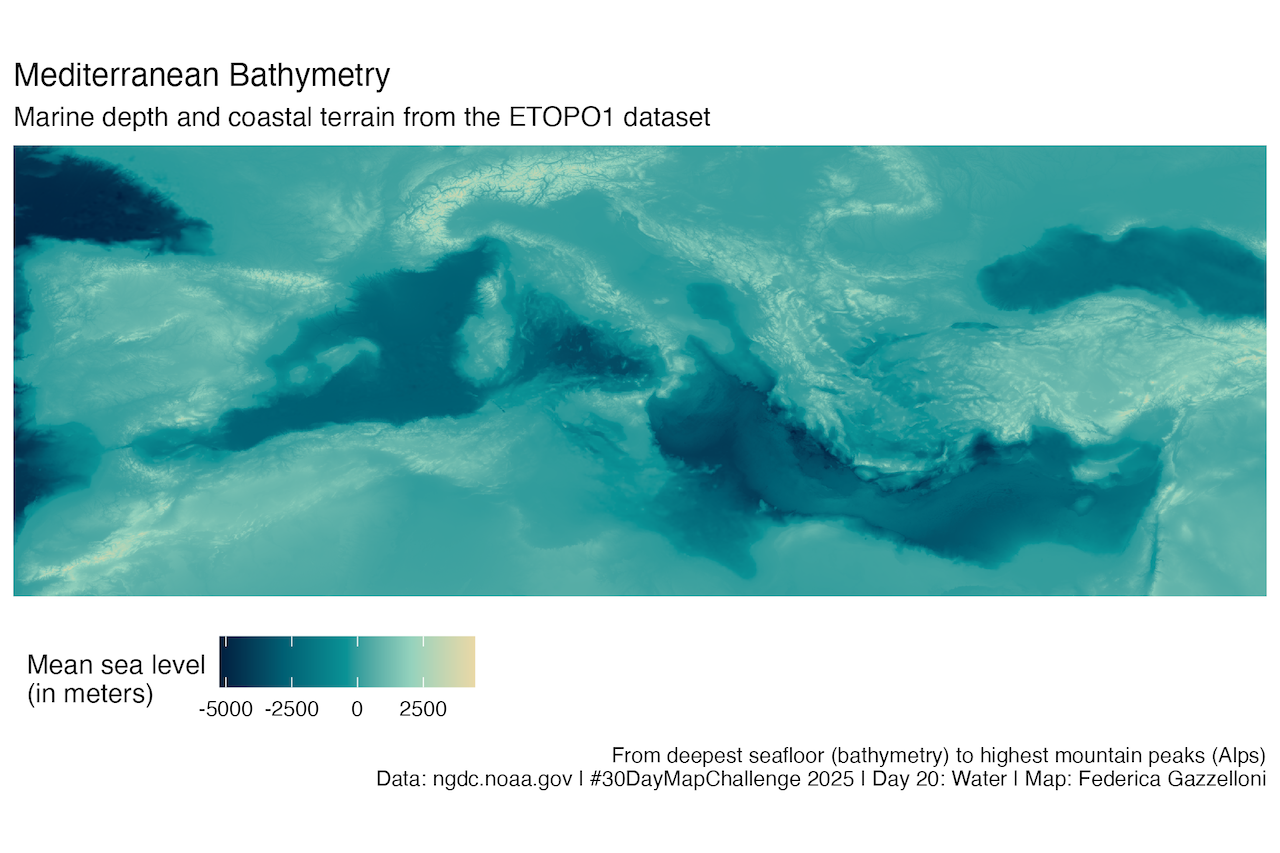
scale_fill_gradientn(
colors = c("#001f3f", "#005f73", "#0a9396", "#94d2bd", "#e9d8a6")
) +
coord_sf(expand = FALSE) +
labs(
title = "Mediterranean Bathymetry",
subtitle = "Marine depth and coastal terrain from the ETOPO1 dataset",
caption = "From deepest seafloor (bathymetry) to highest mountain peaks (Alps)\nData: ngdc.noaa.gov | #30DayMapChallenge 2025 | Day 20: Water | Map: Federica Gazzelloni",
fill = "Mean sea level\n(in meters)"
) +
ggthemes::theme_map() +
theme(legend.position = "bottom")
ggsave("day20_water.png", width=6,height = 4,dpi=320,bg="white")
Back to top